ELK简介
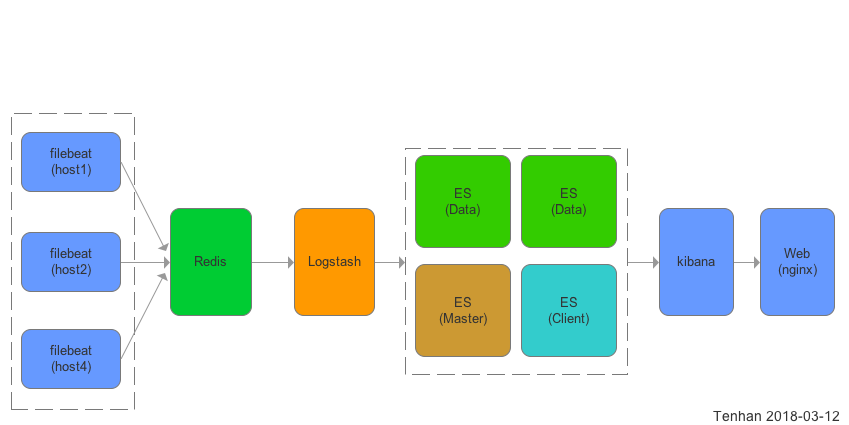
ELK即Elasticsearch + Logstash + Kibana 分布式日志分析系统中的三大组件,结合轻量级的filebeat收集日志信息,可以搭建一套分布式日志分析系统堆栈。
- Elasticsearch是开源的高可伸缩可扩展分布式的全文搜索和分析引擎,底层基于Apache Lucene,允许你快速实时地存储、搜索、分析海量数据,通过restfulAPI向外提供服务。
- Logstash是开源的具有实时管道数据收集功能的软件,可以从各种各样的数据源中收集数据并过滤处理,使数据统一标准化、再发送至目标。
- Kibana是开源的基于Elasticsearch的数据可视化分析平台,本身就是一个web服务器,可以很方便地制作直方图、表格、扇形图、地域分布等报表。
- filebeat是go语音写的轻量级日志文件搬运工,占用资源极低,一般在需要收集日志的服务器上仅仅安装filebeat即可,它的主要工作是对配置中指定的日志文件进行定时扫描,发现有新日志写入,马上读取新内容发送至logstash或elasticsearch。
- 总体实现的功能有:实时全文搜索所有日志信息,根据不同服务器来源的web访问日志进行并发、流量、错误码占比分析、用户地域分布、热点URI、热点IP、活跃用户等信息统计。
Elasticsearch应用场景:
- 一个商品网站,用户可以通过关键字搜索商品信息,比如通过商家、商品名等;
- 收集日志进行实时分析和搜索,并通过kibana展示指标信息;
- 商品价格提醒,例如实现这样的需求:用户希望某个商品价格低于30元时收到通知提醒。
部署说明
- 本文档部署环境为centos7-64bit,ELK版本为6.x系列,只有相同版本系列的组件才能相互搭配使用。
- 使用filebeat作为轻量级收割机收集日志,Redis队列作为filebeat与logstash的中间件,nginx反向代理作为kibana访问鉴权,Elasticsearch存储数据,logstash作为过滤器。
- 地域映射使用第三方IP地理位置数据库GeoLite2,每月第一个周二更新。免费版支持到2018年4月,后续使用需商业用户。
- 可选X-Pack组件作为elasticearch的集群监控和管理,需付费。
数据说明
整个系统只有Elasticsearch存储数据,占用磁盘空间大约是日志文件大小的3倍,可以通过定时器定时删除过期索引。 Elasticsearch的内存占用可以通过参数决定,内存越大,搜索速度越快,可根据业务动态调整。export ES_HEAP_SIZE=2g
数据流:
- filebeat在服务端监控日志文件新增的内容,发送至redis队列
- logstash监控redis队列,将每一条日志内容从队列取出进行过滤处理后形成一个文档,将文档发送至Elasticsearch集群存储
- Kibana根据配置从Elasticsearch搜索日志文档作为报表展示
基本架构
资源评估
- JAVA1.8环境,运行logstash和Elasticsearch进程本身占用内存约400MB
- logstash 6.1.3 日志接收和过滤,然后转移给Elasticsearch ,本身无数据存储,默认端口5044
- Elasticsearch 6.x 全文搜索引擎,占用硬盘数据和内存较多,磁盘占用参考mysql,创建索引越多,磁盘消耗越大,默认占用最大堆内存为1GB,可配置,内存越大搜索越快。(配置内存命令export ES_HEAP_SIZE=10g),默认端口9200
- kibana 6.1.3 提供日志web展示,报表等,数据直接来源于Elasticsearch,本身无数据存储,默认访问端口5601
- (选用)nginx 1.12.2 反向代理实现kibana登录认证,因为kibana本身是直接访问的,无密码验证,如果是内网访问可不安装。
测试结果:
——————————-5MB日志———————————– 内存占用 [root@localhost lps -e -o ‘pid,comm,args,pcpu,rsz,vsz,stime,user,uid’ |grep java 122375 java /bin/java -Xms1g -Xmx1g -XX 0.9 1325524 3267204 11:16 elastic+ 989 128651 java /bin/java -XX:+UseParNewGC 7.4 429900 3261948 15:12 logstash 988 128970 grep grep –color=auto java 0.0 972 112660 15:38 root 0 磁盘占用约16MB [root@localhost logstash]# du -sh /var/lib/elasticsearch/ 16M /var/lib/elasticsearch/
——————————-1GB日志———————————– 双核4G内存的虚拟机CPU满载每秒处理1000条日志,1G日志里约600万条日志,处理耗时1.5小时 处理后内存占用: [root@localhost var]# ps -e -o ‘pid,comm,args,pcpu,rsz,vsz,stime,user,uid’ |grep java 978 grep grep –color=auto java 0.0 972 112660 17:34 root 0 122375 java /bin/java -Xms1g -Xmx1g -XX 3.1 987860 3697800 11:16 elastic+ 989 130939 java /bin/java -XX:+UseParNewGC 43.4 448520 3308164 17:01 logstash 988 磁盘占用2.7GB [root@localhost var]# du -sh /var/lib/elasticsearch/ 2.7G /var/lib/elasticsearch/
以上服务端配置启动后空转内存占用约为700M,磁盘占用依据日志量和索引而定,大约3倍,如果有1G日志文件,大约需要至少3G磁盘空间,Elasticsearch内存可以控制的,即使有100G数据,只配置1G内存也无所谓,只是搜索速度会慢一些。
通过配置export ES_HEAP_SIZE=1g 来控制ES的内存最大值,官方的建议是分配实例所在机器内存的50%但不要超过32GB,因为ES是Java写的,即使在64bit机器上,Java也是尽量使用32bit的压缩指针。 目前日志的产生速度约为50条每秒,单机即可处理。
术语解析
Elasticsearch
集群(Cluster)
每一个节点都要配置自己实例的集群名称,所有相同集群名称的节点为同一个集群,由ES自带的集群管理功能控制。
节点(Node)
简单理解,启动一个ES实例就是一个节点。
索引(Index)
ES是通过索引来确定数据存在什么地方的,类似于mysql的表,知道了表名就知道数据在哪,知道了索引名称,就能通过路由知道数据在哪个节点、哪个分片。
文档(Document)
类似于mysql的一条记录,只是字段不必规范化,可以包含任意字段,类似MongoDB的文档。
字段
字段就是文档key-value中的key 很多时候为了提高搜索效率,我们需要指定每个字段的数据类型,一般分为两大类:精确类型和字符串类型。 精确类型例如整型、浮点型、时间戳等。 字符串类型又分为关键词和文本类型,关键词类型的字符串比如uuid、imei等是不允许进行分词的(分词也无意义),否则报错。文本类型则是可以进行分词和全文搜索的。
分片(Shards)
分片类似于mysql的按uid取模分表,解决单点数据量过大的问题。例如一个节点只有500GB磁盘,但某个索引有1TB数据,这时候就需要指定分片数量,至ES如何分片则是透明的,我们无需干涉。 注意点:分片数量一旦确定下来不可更改,如果一定要更改,需要重建索引,消耗巨大的资源。 分片过多会带来诸多负面影响,例如:每次查询后需要汇总排序的数据更多;过多的并发带来的线程切换造成过多的CPU损耗;索引的删除和配置更新更慢。
副本(Replicas)
副本就是索引复制的份数,例如有一个索引设置副本为3,则在整个集群中有4份一模一样的数据(逻辑上),副本越多,占用磁盘越大,数据可靠性越高。 一般来说,副本的作用基本上就是冗余备份和负载均衡。
倒排序
倒排序是全文搜索的核心,在分词的基础上,建立一张词到文档的映射表,可以快速查找到一个词所属的文档有哪些。
另外,ES对于中文默认是按字分词的,如果需要粗粒度的分词需求,需要使用第三方插件,开源免费的插件有elasticsearch-analysis-ik。
Segment
一个segment是一个完备的lucene倒排索引
与Elasticsearch交互
通过RestfulAPI
curl -X<VERB> '<PROTOCOL>://<HOST>:<PORT>/<PATH>?<QUERY_STRING>' -d '<BODY>'
为了方便,建议使用kibana自带的开发工具进行调试。
PUT /megacorp/employee/1
{
    "first_name" : "John",
    "last_name" :  "Smith",
    "age" :        25,
    "about" :      "I love to go rock climbing",
    "interests": [ "sports", "music" ]
}
分布式查询:
ES会尽最大努力返回尽可能多的数据,如果有些节点查询失败或超时,只返回已查询到的数据,因此数据不是100%精确和完整的,但你可以根据结果判断结果是否完整。

通过yum安装ELK
yum install java-1.8.0-openjdk*
rpm –import https://artifacts.elastic.co/GPG-KEY-elasticsearch
vim /etc/yum.repos.d/elastic.repo #写入内容:
[elasticsearch-6.x]
name=Elasticsearch repository for 6.x packages
baseurl=https://artifacts.elastic.co/packages/6.x/yum
gpgcheck=1
gpgkey=https://artifacts.elastic.co/GPG-KEY-elasticsearch
enabled=1
autorefresh=1
type=rpm-md
在进行日志数据分析和存储的服务器上安装 yum install -y elasticsearch kibana logstash
在所有需要收集日志的服务器上仅安装filebeat即可。 yum install -y filebeat
配置filebeat
参考文档 YAML标准
阮一峰的YAML语言教程
warning: The @metadata.type field, added by the Logstash output, is deprecated, hardcoded to doc, and will be removed in Filebeat 7.0.
重置filebeat收割状态,删除/var/lib/filebeat/registry
下面配置filebeat监控日志文件并发送至redis队列,tags用户对日志进行分类。
vim /etc/filebeat/filebeat.yml
filebeat.prospectors:
# Each - is a prospector. Most options can be set at the prospector level, so
# you can use different prospectors for various configurations.
# Below are the prospector specific configurations.

- type: log

  # Change to true to enable this prospector configuration.
  enabled: true

  # Paths that should be crawled and fetched. Glob based paths.
  paths:
    - /var/log/*.log
  tags: ["syslog"]
- type: log
  paths:
    - /var/log/nginx/host.access.log
  tags: ["nginxaccess"]
- type: log
  paths:
    - /var/lumen.log
  tags: ["lumenerror"]
  #匹配多行日志
  multiline.pattern: '^\['
  multiline.negate: true
  multiline.match: after
# 指定redis为事件发送目标,其中key为redis队列的key
output.redis:
  hosts: ["127.0.0.1"]
  password: "12345678"
  key: "filebeat"
  db: 0
  timeout: 5
为了区分不同来源的日志文件,可以自定义配置filebeat的name,如果不配置,将使用本机host作为name。
启动filebeat systemctl start filebeat
向日志文件写入内容测试: echo ‘[2018-03-12T08:00:00+0800] hello world!’ >> /var/lumen.log
filebeat监控到文件变化,会将上面写入的内容发送至redis队列,我们查看redis的key为filebeat的队列中已经躺着一条数据:
{\"@timestamp\":\"2018-03-14T12:49:16.866Z\",\"@metadata\":{\"beat\":\"\",\"type\":\"doc\",\"version\":\"6.1.3\"},\"beat\":{\"name\":\"localhost.localdomain\",\"hostname\":\"localhost.localdomain\",\"version\":\"6.1.3\"},\"source\":\"/data/log/lumen1.log\",\"offset\":15069,\"message\":\"[2018-03-12T08:00:00+0800] hello world!\",\"tags\":[\"lumenerror\"],\"prospector\":{\"type\":\"log\"}}
格式化后如下:
{
    "@timestamp": "2018-03-14T12:49:16.866Z",
    "@metadata": {
        "beat": "",
        "type": "doc",
        "version": "6.1.3"
    },
    "beat": {
        "name": "localhost.localdomain",
        "hostname": "localhost.localdomain",
        "version": "6.1.3"
    },
    "source": "/data/log/lumen1.log",
    "offset": 15069,
    "message": "[2018-03-12T08:00:00+0800] hello world!",
    "tags": [
        "lumenerror"
    ],
    "prospector": {
        "type": "log"
    }
}
可以看到filebeat已经读取到文件变化的内容并编码保存到redis队列中,logstash可以从该队列中读取该事件作进一步处理。 在redis队列中保存的仅仅是日志原样的文本信息,这时需要logstash进一步解析,提取时间戳、IP等有用的信息,然后再发送至elasticsearch。
配置Elasticsearch
建议至少使用两个物理分隔的实例进行分片副本冗余备份,在同一台物理机上部署多个实例冗余备份没有意义(还浪费磁盘空间)。 Elasticsearch默认没有鉴权功能,需要使用第三方插件例如X-pack,需付费。
这里示例在机器A和机器B上已安装Elasticsearch,下面配置A和B成为同一集群的两个节点,A、B的IP地址分别为:192.168.82.35,192.168.82.4。
在机器A上配置 vim /etc/elasticsearch/elasticsearch.yml
cluster.name: test_cluster                              # 所有节点使用同一个集群名称
node.name: node-1                                # 节点名称,用于在日志中区分

path.data: /var/lib/elasticsearch                       # 数据的默认存放路径
path.logs: /var/log/elasticsearch                       # 日志的默认存放路径

network.host: 0.0.0.0
http.port: 9200                                         # 对外提供服务的端口,9300为集群服务的端口

# 集群每个节点IP地址
discovery.zen.ping.unicast.hosts: ["192.168.82.35","192.168.82.4"]

discovery.zen.minimum_master_nodes: 2                   # 为了避免脑裂,设置有master资格集群节点数最少为半数+1
在机器B上配置 vim /etc/elasticsearch/elasticsearch.yml
cluster.name: test_cluster
node.name: node-2
path.data: /var/lib/elasticsearch
path.logs: /var/log/elasticsearch
network.host: 0.0.0.0
http.port: 9200
discovery.zen.ping.unicast.hosts: ["192.168.82.4","192.168.82.35"]
discovery.zen.minimum_master_nodes: 2
增加更多节点,只要在配置文件中使用相同的集群名称,并在发现IP列表中添加本机IP即可,如果是在局域网中,可以不配置,ES会自动发现,只要保证集群名称相同。
注意:如果需增加一台机器,需要在所有其它机器的配置文件中增加新增机器的ip并重启。
脑裂就是ES出现多个master节点,导致数据异常。
如何避免Elasticsearch集群脑裂
启动A和B的ES实例 systemctl restart elasticsearch
查看elasticsearch集群健康状态 curl -XGET ‘localhost:9200/_cluster/health?pretty’ 可看到类似下面的内容:
{
  "cluster_name" : "test_cluster",
  "status" : "yellow",
  "timed_out" : false,
  "number_of_nodes" : 2,
  "number_of_data_nodes" : 2,
  "active_primary_shards" : 194, # 集群中的主分片数量
  "active_shards" : 362, # 集群中的所有分片数量,包括分片副本
  "relocating_shards" : 0,
  "initializing_shards" : 2, # 刚刚创建的分片的个数
  "unassigned_shards" : 27,  # 是已经在集群状态中存在的分片,但是实际在集群里又找不着
  "delayed_unassigned_shards" : 0,
  "number_of_pending_tasks" : 0,
  "number_of_in_flight_fetch" : 0,
  "task_max_waiting_in_queue_millis" : 0,
  "active_shards_percent_as_number" : 92.58312020460357
}
可以看到,集群名称为test_cluster并且有两个节点。 主要关注status即可,status为red则不可用(主分片缺失),yellow为可用但是有一些副本丢失,green则集群是100%可用状态。
可以通过curl -XGET ‘localhost:9200/_cluster/health?level=indices&pretty’ 查看每个所有的状态 查看集群状态 curl -XGET ‘localhost:9200/_cluster/stats?pretty’ 查看所有索引占的资源:curl -XGET ‘localhost:9200/_all/_stats?pretty’
配置logstash
- 下载地理位置数据库
$ cd  /etc/logstash/
$ wget http://geolite.maxmind.com/download/geoip/database/GeoLite2-City.tar.gz
$ tar -xvf ./GeoLite2-City.tar.gz
#/etc/logstash/GeoLite2-City_20180306/GeoLite2-City.mmdb
- 当前使用的nginx日志规则为(注意:$http_devicemodel,,后面是两个逗号,$http_log后面有一个多余的空格):
log_format custom_v2 '$http_x_forwarded_for,$remote_addr,$remote_user,$upstream_response_time,$request_time,[$time_local],$http_uid,$http_imei,$http_device,$http_platform,$http_versioncode,$http_devicemodel,,"$request",'
			'$status,$body_bytes_sent,"$http_referer",'
			'"$http_user_agent","$http_x_forwarded_for",$http_lat,$http_log,$http_host';
当前nginx访问日志样例:
-,27.36.144.193,-,0.047,0.047,[18/Dec/2017:23:59:59 +0800],-,40BE7CF9-4701-4D9D-B554-29299CEC81FF,1,69,33,iPhone9,2,,"POST /exampleapi1 HTTP/1.1",200,570,"-","NewBeautifulLive/3.3 (iPhone; iOS 11.0.3; Scale/3.00)","-",23.018497,113.089044 ,voapi.example.com

-,36.23.107.162,-,0.111,0.111,[19/Dec/2017:00:00:01 +0800],4172641,866402030389598,2,3485,239,GIONEE M7,,"GET /exampleapi2?page=1&with_comment=0&pagesize=16&beauty_uid=4218994 HTTP/1.1",200,1429,"-","Dalvik/2.1.0 (Linux; U; Android 7.1.1; GIONEE M7 Build/N6F26Q)","-",30.165188,120.288826 ,vaapi.example.com

-,112.49.30.85,-,0.125,0.128,[18/Dec/2017:23:59:59 +0800],3854115,70340B75-0239-4870-B8C7-AC9E7F2417F9,1,69,33,iPhone8,2,,"POST /exampleapi3?t=1513612799.281175 HTTP/1.1",200,7269,"-","NewBeautifulLive/3.3 (iPhone; iOS 11.1.2; Scale/3.00)","-",nan,nan ,voapi.example.com

-,14.18.236.76,-,0.049,0.049,[18/Dec/2017:23:59:57 +0800],4395638,E1E5187B-607B-4C43-88F1-D324CADEDE16,1,3437,44,x86_64,,"GET /exampleapi4?u_id=4395638 HTTP/1.1",200,49,"-","NewBeautifulLive/1.4 (iPhone; iOS 11.1; Scale/3.00)","-",37.785834,-122.406417 ,voapi.example.com

-,1.69.46.196,-,0.029,0.029,[18/Dec/2017:23:59:10 +0800],,B42CF305-46CB-4F7A-A519-6CF0E65C9956,1,3437,44,iPhone7,2,,"GET /exampleapi5 HTTP/1.1",200,275,"-","NewBeautifulLive/1.4 (iPhone; iOS 9.3.1; Scale/2.00)","-",0.000000,0.000000 ,voapi.example.com
lumen错误日志样例(注意:filebeat默认读取一行作为一条日志,对于lumen需要配置filebeat匹配多行作为一条日志):
[2018-03-12 22:53:09] lumen.ERROR: 用户登录,无效请求协议头...
[2018-02-08 22:48:22] lumen.ERROR: exception 'PDOException' with message 'SQLSTATE[23000]: Integrity constraint violation: 1062 Duplicate entry '864335035747273' for key 'imei'' in //lumen/vendor/illuminate/database/Connection.php:449
Stack trace:
#0 /lumen/vendor/illuminate/database/Connection.php(449): PDOStatement->execute()
#1 /lumen/vendor/illuminate/database/Connection.php(640): Illuminate\Database\Connection->Illuminate\Database\{closure}('insert into `cd...', Array)...
系统日志样例(/var/log/yum.log):
Jan 31 16:48:56 Installed: kibana-6.1.3-1.x86_64
Jan 31 16:48:57 Installed: elasticsearch-6.1.3-1.noarch
Jan 31 16:49:13 Installed: 1:logstash-6.1.3-1.noarch
Jan 31 17:44:24 Installed: 1:nginx-1.12.2-1.el7_4.ngx.x86_64
Jan 31 17:45:28 Installed: httpd-tools-2.4.6-67.el7.centos.6.x86_64
- 根据日志定制配置logstash正则表达式
新建文件:
mkdir /etc/logstash/patterns
vim /etc/logstash/patterns/my.patterns
写入内容
HTTPDUSER %{EMAILADDRESS}|%{USER}
HTTPDERROR_DATE %{DAY} %{MONTH} %{MONTHDAY} %{TIME} %{YEAR}

LUMEN_LOG_DATE %{DATE} %{TIME}

HTTPD_COMMONLOG %{IPORHOST:clientip} %{HTTPDUSER:ident} %{HTTPDUSER:auth} \[%{HTTPDATE:timestamp}\] "(?:%{WORD:method} %{NOTSPACE:request}(?: HTTP/%{NUMBER:httpversion})?|%{DATA:rawrequest})" %{NUMBER:response} (?:%{NUMBER:bytes}|-)
HTTPD_COMBINEDLOG %{HTTPD_COMMONLOG} %{QS:referrer} %{QS:agent}

HTTPD20_ERRORLOG \[%{HTTPDERROR_DATE:timestamp}\] \[%{LOGLEVEL:loglevel}\] (?:\[client %{IPORHOST:clientip}\] ){0,1}%{GREEDYDATA:message}
HTTPD24_ERRORLOG \[%{HTTPDERROR_DATE:timestamp}\] \[%{WORD:module}:%{LOGLEVEL:loglevel}\] \[pid %{POSINT:pid}(:tid %{NUMBER:tid})?\]( \(%{POSINT:proxy_errorcode}\)%{DATA:proxy_message}:)?( \[client %{IPORHOST:clientip}:%{POSINT:clientport}\])?( %{DATA:errorcode}:)? %{GREEDYDATA:message}
HTTPD_ERRORLOG %{HTTPD20_ERRORLOG}|%{HTTPD24_ERRORLOG}

FORWORD (?:%{IPV4}[,]?[ ]?)+|%{WORD}

HOSTPORT %{IPORHOST}:%{POSINT}

NGINXACCESS (%{FORWORD:x_forword_for}|-),%{IPORHOST:clientip},(%{USERNAME:http_user}|-),%{BASE16FLOAT:upstream_response_time},%{BASE16FLOAT:request_time},\[%{HTTPDATE:timestamp}\],(%{NUMBER:uid}|-|),%{NOTSPACE:imei},%{NUMBER:device},%{NUMBER:platform},%{NUMBER:versioncode},%{DATA:devicemodel},,"(?:%{WORD:method} %{URIPATH:uri}(%{URIPARAM:params}|)(?: HTTP/%{NUMBER:httpversion})?|%{DATA:rawrequest})",%{NUMBER:http_status},(?:%{NUMBER:bytes}|-),"(%{DATA:referrer}|-)","%{DATA:agent}","(%{FORWORD:x_forword_for}|-)",(%{NUMBER:http_lat}|nan),(%{NUMBER:http_log}|nan) ,%{IPORHOST:http_host}

APACHEACCESS (%{IPORHOST:clientip}|-) (%{USERNAME:user}|-) (%{USERNAME:auth}|-) \[%{HTTPDATE:timestamp}\] "(?:%{WORD:method} %{URIPATH:uri}(%{URIPARAM:params}|)(?: HTTP/%{NUMBER:httpversion})?|%{DATA:rawrequest})" %{NUMBER:response} (?:%{NUMBER:bytes}|-) "(%{DATA:referrer}|-)" "%{DATA:agent}"
正则调试地址(需要翻墙)https://grokdebug.herokuapp.com/
- 在配置目录/etc/logstash/conf.d/下所有.conf后缀的配置文件都会被logstash加载使用,可以将配置文件按照功能划分为多个文件。这里使用一个配置文件即可:
注意:input中的redis配置中的threads是指开启处理队列的线程数,当日志量较大时可以适当调整改值。 因为logstash同时处理nginx和lumen等不同类型日志,这些日志内容格式不一样,因此需要分类处理。
vim /etc/logstash/conf.d/logstash-simple.conf
# 与filebeat的输出保持一致
input {
    redis {
        data_type => "list"
        key => "filebeat"
        host => "127.0.0.1"
        port => 6379
        password => "12345678"
        db => 0
        threads => 1
    }
}

filter {

    # tags 除了包含filebeat指定的标记外,还会包含日志解析过程中发生错误标记,例如如果日志grok解析失败,tags会包含_grokparsefailure标记,可用于分析。
    if "nginxaccess" in [tags] {
        # Nginx 访问日志
        grok {
            patterns_dir =>  "/etc/logstash/patterns/my.patterns"
            match => {"message" => "%{NGINXACCESS}"}
            add_field => [ "received_at", "%{@timestamp}" ]
        }
        date {
            match => [ "timestamp" , "dd/MMM/YYYY:HH:mm:ss Z" ]
        }
        geoip {
            source => "clientip"
            target => "geoip"
            database => "/etc/logstash/GeoLite2-City_20180306/GeoLite2-City.mmdb"
            add_field => [ "[geoip][coordinates]", "%{[geoip][longitude]}" ]
            add_field => [ "[geoip][coordinates]", "%{[geoip][latitude]}"  ]
        }
        if [agent] != "-" {
            useragent {
            target => "ua"
            source => "agent"
            }
        }
        # 必须转换到合适的精确类型或字符串,避免自动识别错误,导致没法统计
        mutate {
            replace => { type => "nginxaccess" }
            convert => [ "[geoip][coordinates]", "float" ]
            convert => [ "http_status","integer" ]
            convert => [ "uri","string" ]
            convert => [ "params","string" ]
            convert => [ "uid","integer" ]
            convert => [ "device","integer" ]
            convert => [ "platform","integer" ]
            convert => [ "http_user","string" ]
            convert => [ "upstream_response_time","float" ]
            convert => [ "request_time","float" ]
            convert => [ "imei","string" ]
            convert => [ "versioncode","string" ]
            convert => [ "method","string" ]
            convert => [ "devicemodel","string" ]
            convert => [ "httpversion","float" ]
            convert => [ "bytes","integer" ]
            convert => [ "referrer","string" ]
            convert => [ "agent","string" ]
            convert => [ "http_lat","float" ]
            convert => [ "http_log","float" ]
            convert => [ "http_host","string" ]
        }
    }else if "lumenerror" in [tags] {
        # lumen 错误日志
         mutate { replace => { "type" => "lumenerror" } }
         grok {
            patterns_dir =>  "/etc/logstash/patterns/my.patterns"
            match => { "message" => "%{LUMEN_LOG_DATE:timestamp}" }
            add_field => [ "received_at", "%{@timestamp}" ]
        }
        date {
            match => [ "timestamp", "yyyy-MM-dd HH:mm:ss","dd/MMM/YYYY:HH:mm:ss Z"]
        }
    }else if "syslog" in [tags]{
        # 系统日志
        mutate { replace => { "type" => "syslog" } }
        grok {
            match => { "message" => "%{SYSLOGTIMESTAMP:timestamp}" }
            add_field => [ "received_at", "%{@timestamp}" ]
        }
        date {
            match => [ "timestamp", "MMM  d HH:mm:ss", "MMM dd HH:mm:ss" ]
        }

    }else{
        # 其它日志
        mutate { replace => { "type" => "other" } }
        grok {
            match => { "message" => "%{TIMESTAMP_ISO8601:timestamp}" }
            add_field => [ "received_at", "%{@timestamp}" ]
        }
        date {
            match => [ "timestamp","MMM dd HH:mm:ss","yyyy-MM-dd HH:mm:ss"]
        }

    }
}
output {
   elasticsearch {
            hosts => ["localhost:9200"]
            #根据日志类型按天创建索引
            index => "logstash-%{type}-%{+YYYY.MM.dd}"
        }
    stdout { codec => rubydebug }
}
启动logstash systemctl start logstash 启动后logstash已经开始从redis队列中读取数据并过滤分析,然后发送至elasticsearch。
X-Pack安装(付费功能,选用)
X-Pack是监控Elasticsearch集群的工具
参考文档
安装
/usr/share/elasticsearch/bin/elasticsearch-plugin install x-pack /usr/share/kibana/bin/kibana-plugin install x-pack /usr/share/elasticsearch/bin/x-pack/setup-passwords interactive
vim /etc/kibana/kibana.yml elasticsearch.username: “kibana” elasticsearch.password: “kibanapassword”
nginx反向代理鉴权实现(如果不使用付费的X-pack,可用此方法)
yum install nginx httpd-tools
# 按提示设置密码,username改为自定义的用户名
htpasswd -c /etc/nginx/passwd username

vim /etc/nginx/nginx.conf
server {
        listen       8080 default_server;
        listen       [::]:8080 default_server;
        server_name  _;
        root         /usr/share/nginx/html;

        # Load configuration files for the default server block.
        include /etc/nginx/*.conf;

        # 如nginx已经安装,与web共用,则将location /改为location /app/kibana/
        location / {
            auth_basic           "Please input username and password.";
            auth_basic_user_file /etc/nginx/default.d/passwd;

            proxy_pass            http://localhost:5601/;
            proxy_set_header      Host      $host;
            proxy_set_header X-Real-Ip $remote_addr;
            proxy_set_header X-Forwarded-For $remote_addr;
    }
}
kibana访问
启动kibana systemctl start kibana 默认kibana只允许本地访问:localhost:5601,需要外部直接访问,修改配置文件或通过反向代理实现访问 配置文件位置:/etc/kibana/kibana.yml ‘0.0.0.0’代表任何IP可以访问,也可以绑定特定IP。 server.host: “0.0.0.0”
使用说明
Elasticsearch
以下localhost:9200代表Elasticsearch的地址
常用命令
- 检查集群健康状况, curl -XGET localhost:9200/_cluster/health?pretty
- 查看所有索引状态 curl ‘localhost:9200/_cat/indices?v’
PHP客户端通过API访问ES数据
参考文档
《Elasticsearch 权威指南》中文版 以下代码使用上述部署的ELK收集的Nginx日志作为数据源
· 安装ES客户端:
composer require elasticsearch/elasticsearch
· 创建客户端
<?php
use Elasticsearch\ClientBuilder;
//每一个host配置代表一个节点,客户端会首先连接第一个节点,如果连接失败,则尝试连接第二个,以此类推。
//如果全部节点均连接失败,抛出OperationTimeoutException异常
$hosts = [
            '192.168.82.35:9200',         // IP + 端口
            '192.168.82.35',              // 仅IP,默认端口9200
            'localhost:9201', // 域名+端口
            'localhost',     // 仅域名,默认端口9200
            'https://localhost',        // SSL + localhost
            'https://192.168.82.35:9200'  // SSL + IP + 端口
        ];
$clientBuilder = ClientBuilder::create();
$clientBuilder->setHosts($hosts);
$client = $clientBuilder->build();
· 创建索引
$params = [
            'index' => 'test_index',
            'body' => [
                'settings' => [
                    //分片数量,创建后不可更改,如果要更改,需要重建索引,可能耗时巨大。
                    'number_of_shards' => 3,
                    //分片副本数量,用于备份和负载均衡
                    'number_of_replicas' => 2
                ],
                //字段映射
                'mappings' => [
                    'test_type' => [
                        //内置字段
                        '_source' => [
                            'enabled' => true
                        ],
                        'properties' => [
                            //字段
                            //5.X以上版本没有string类型,换成text和keyword作为字符串类型,其中keyword不能用于分词,适合例如uuid,imei字段,text将默认进行分词。
                            'uuid' => [
                                'type' => 'keyword',
                            ],
                            'first_name' => [
                                'type' => 'text',
                                //使用标准语法分析器进行分词
                                'analyzer' => 'standard'
                            ],
                            'rate' => [
                                'type' => 'float',
                            ],
                            'age' => [
                                'type' => 'integer'
                            ]
                        ]
                    ]
                ]
            ]
        ];
$response = $client->indices()->create($params);
var_dump($response);
//结果: array(3) { ["acknowledged"]=> bool(true) ["shards_acknowledged"]=> bool(true) ["index"]=> string(10) "test_index" }
· 根据字段查找文档
$params = [
            'index' => 'logstash-nginxaccess-demo*',
            'type' => 'doc',
            'body' => [
                'query' => [
                    'match' => [
                        'http_status' => '502'
                    ]
                ]
            ]
        ];
try{
        $response = $client->search($params);
    }catch (\Exception $e){
            var_dump($e);
       }
        if(isset($response)){
            var_dump($response);
    }
· 查找某段时间内活跃的top10用户uid
$params = [
            'index' => 'logstash-nginxaccess-demo*',
            'type' => 'doc',
            'body' => [
                'query'=>[
                    'range'=>[
                        '@timestamp'=>[
                            'from'=>'2017-01-10T00:00:00+0800',
                            'to'=>'2018-12-10T00:00:00+0800'
                        ]
                    ]
                ],
                //size=10,标识我们并不关心具体文档内容,只需要查找结果,这样可以加快查找速度
                'size'=>0,
                'aggs'=>[
                    'popular_uid'=>[
                        'terms'=>[
                            'field'=>'uid',
                        ],
                    ]
                ]
            ]
        ];
        try{
            $response = $client->search($params);
        }catch (\Exception $e){
            die('ERROR');
        }
        if(isset($response)){
            var_dump($response);
        }

结果:
array(5) { ["took"]=> int(197) ["timed_out"]=> bool(false) ["_shards"]=> array(4) { ["total"]=> int(15) ["successful"]=> int(15) ["skipped"]=> int(0) ["failed"]=> int(0) } ["hits"]=> array(3) { ["total"]=> int(826344) ["max_score"]=> float(0) ["hits"]=> array(0) { } } ["aggregations"]=> array(1) { ["popular_uid"]=> array(3) { ["doc_count_error_upper_bound"]=> int(4516) ["sum_other_doc_count"]=> int(626831) ["buckets"]=> array(10) { [0]=> array(2) { ["key"]=> int(20252) ["doc_count"]=> int(22216) } [1]=> array(2) { ["key"]=> int(3854115) ["doc_count"]=> int(16798) } [2]=> array(2) { ["key"]=> int(4158384) ["doc_count"]=> int(11381) } [3]=> array(2) { ["key"]=> int(4260195) ["doc_count"]=> int(8671) } [4]=> array(2) { ["key"]=> int(4286196) ["doc_count"]=> int(8435) } [5]=> array(2) { ["key"]=> int(3672423) ["doc_count"]=> int(8409) } [6]=> array(2) { ["key"]=> int(20195) ["doc_count"]=> int(8306) } [7]=> array(2) { ["key"]=> int(4218966) ["doc_count"]=> int(7668) } [8]=> array(2) { ["key"]=> int(4056951) ["doc_count"]=> int(7390) } [9]=> array(2) { ["key"]=> int(4291401) ["doc_count"]=> int(6694) } } } } }

当无数据返回时,total为0
返回结果buckets数组中的key代表用户uid,doc_count代表文档数量;
可得前10活跃用户uid为:
1. 20252
2. 3854115
3. 4158384
...


· 查询实时并发(直方图)
```php
 $params = [
            'index' => 'logstash-nginxaccess-demo*',
            'type' => 'doc',
            'body' => [
                'query'=>[
                    'range'=>[
                        '@timestamp'=>[
                            'from'=>'2017-01-10 00:00:00',
                            'to'=>'2018-12-10 00:00:00'
                       ]
                    ]
                ],
                //size=10,标识我们并不关心具体文档内容,只需要查找结果,这样可以加快查找速度
                'size'=>0,
                'aggs'=>[
                    'pv'=>[
                        'date_histogram'=>[
                            'field'=>'@timestamp',
                            'interval'=>'day',
                            'format'=> 'yyyy-MM-dd',
                            'min_doc_count'=>0,//强制返回空buckets
                            'extended_bounds'=>[
                                'min'=>'2017-01-10',
                                'max'=>'2018-12-10'
                            ]
                        ]
                    ]
                ]
            ]
        ];
        try{
            $response = $client->search($params);
        }catch (\Exception $e){
            die($e->getMessage());
        }
        if(isset($response)){
            var_dump($response);
        }

结果:
array(5) { ["took"]=> int(113) ["timed_out"]=> bool(false) ["_shards"]=> array(4) { ["total"]=> int(15) ["successful"]=> int(15) ["skipped"]=> int(0) ["failed"]=> int(0) } ["hits"]=> array(3) { ["total"]=> int(826344) ["max_score"]=> float(0) ["hits"]=> array(0) { } } ["aggregations"]=> array(1) { ["pv"]=> array(1) { ["buckets"]=> array(86) { [0]=> array(3) { ["key_as_string"]=> string(10) "2017-12-17" ["key"]=> int(1513468800000) ["doc_count"]=> int(88457) } [1]=> array(3) { ["key_as_string"]=> string(10) "2017-12-18" ["key"]=> int(1513555200000) ["doc_count"]=> int(725109) } [2]=> array(3) { ["key_as_string"]=> string(10) "2017-12-19" ["key"]=> int(1513641600000) ["doc_count"]=> int(0) } [3]=> array(3) { ["key_as_string"]=> string(10) "2017-12-20" ["key"]=> int(1513728000000) ["doc_count"]=> int(0) } [4]=> array(3) { ["key_as_string"]=> string(10) "2017-12-21" ["key"]=> int(1513814400000) ["doc_count"]=> int(0) } [5]=> array(3) { ["key_as_string"]=> string(10) "2017-12-22" ["key"]=> int(1513900800000) ["doc_count"]=> int(0) } [6]=> array(3) { ["key_as_string"]=> string(10) "2017-12-23" ["key"]=> int(1513987200000) ["doc_count"]=> int(0) } [7]=> array(3) { ["key_as_string"]=> string(10) "2017-12-24" ["key"]=> int(1514073600000) ["doc_count"]=> int(0) } [8]=> array(3) { ["key_as_string"]=> string(10) "2017-12-25" ["key"]=> int(1514160000000) ["doc_count"]=> int(0) } [9]=> array(3) { ["key_as_string"]=> string(10) "2017-12-26" ["key"]=> int(1514246400000) ["doc_count"]=> int(0) } [10]=> array(3) { ["key_as_string"]=> string(10) "2017-12-27" ["key"]=> int(1514332800000) ["doc_count"]=> int(0) } [11]=> array(3) { ["key_as_string"]=> string(10) "2017-12-28" ["key"]=> int(1514419200000) ["doc_count"]=> int(0) } [12]=> array(3) { ["key_as_string"]=> string(10) "2017-12-29" ["key"]=> int(1514505600000) ["doc_count"]=> int(0) } [13]=> array(3) { ["key_as_string"]=> string(10) "2017-12-30" ["key"]=>
...

返回结果buckets数组中的key代表直方图区间(此处为每一天),doc_count代表访问数量;

...
· 统计安卓和苹果设备访问量占百(扇形图)
 $params = [
            'index' => 'logstash-nginxaccess-demo*',
            'type' => 'doc',
            'body' => [
                'query'=>[
                    'range'=>[
                        '@timestamp'=>[
                            'from'=>'2017-12-17T00:00:00+0800',
                            'to'=>'2018-12-19T00:00:00+0800'
                        ]
                    ]
                ],
                //size=10,标识我们并不关心具体文档内容,只需要查找结果,这样可以加快查找速度
                'size'=>0,
                'aggs'=>[
                    'popular_device'=>[
                        'terms'=>[
                            'field'=>'device',
                        ],
                    ]
                ]
            ]
        ];
        try{
            $response = $client->search($params);
        }catch (\Exception $e){
            die('ERROR');
        }
        if(isset($response)){
            var_dump($response);
        }
结果:
array(5) { ["took"]=> int(161) ["timed_out"]=> bool(false) ["_shards"]=> array(4) { ["total"]=> int(15) ["successful"]=> int(15) ["skipped"]=> int(0) ["failed"]=> int(0) } ["hits"]=> array(3) { ["total"]=> int(826344) ["max_score"]=> float(0) ["hits"]=> array(0) { } } ["aggregations"]=> array(1) { ["popular_device"]=> array(3) { ["doc_count_error_upper_bound"]=> int(0) ["sum_other_doc_count"]=> int(0) ["buckets"]=> array(2) { [0]=> array(2) { ["key"]=> int(2) ["doc_count"]=> int(518881) } [1]=> array(2) { ["key"]=> int(1) ["doc_count"]=> int(294687) } } } } }

返回结果buckets数组中,key代表设备device,doc_count代表访问量
结果可以看出,苹果(1)访问量为294687,安卓(2)访问量为518881,可以依次制作扇形图。
其它聚合统计基本都可以使用上述例子实现。
用kafka替代redis
(官方文档)[http://kafka.apache.org/documentation/]
(kafka原理参考)[http://blog.csdn.net/ychenfeng/article/details/74980531]
当数据量逐渐增大以后,redis队列是没法满足我们的需求,因为redis是内存型数据库,如果生产者写入大量数据,消费者来不及消费,会导致消息积压,耗费内存巨大。 这时候可以考虑使用kafka代替redis,因为kafka的消息积压是存储在磁盘上的,对内存压力可以忽略不计。
kafka消息顺序注意事项(区别于RocketMQ): 每个主题的一个分区内的消息按消息到达时间对应的先后顺序,但因为消息随机发往主题的任意一个分区,因此虽然同一个分区的消息有先后顺序,但是不同分区之间的消息没有先后顺序, 如果我们需要顺序消费消息,只能在创建主题的时候只提供一个分区(分区少会影响并发)。
这里安装使用kafka 1.0
cd /usr/local/src/
wget http://mirrors.hust.edu.cn/apache/kafka/1.0.1/kafka_2.11-1.0.1.tgz
tar -xzf kafka_2.11-1.0.1.tgz
cd /usr/local/src/kafka_2.11-1.0.1
进入Kafka的config目录,修改server.properties mkdir /var/log/kafka
# 每个实例的id,需不同
broker.id=0
# 端口号
port=9092
# 当前服务器的IP,各台服务器值不同
host.name=192.168.82.35
# Zookeeper集群的ip和端口号,逗号分隔
zookeeper.connect=192.168.82.35:2181
# 日志目录,注意是目录
log.dirs=/var/log/kafka
# kafka依赖zookeeper进行集群管理,先要启动zookeeper
./bin/zookeeper-server-start.sh config/zookeeper.properties  &
# 启动kafka
./bin/kafka-server-start.sh config/server.properties &

# 创建主题
# --replication-factor 1 复制因子1,简单来说就是副本的数量
# --partitions 1 指定分区数量为1
# --topic test 主题名称为test
bin/kafka-topics.sh --create --zookeeper localhost:2181 --replication-factor 1 --partitions 1 --topic test

# 查看主题
bin/kafka-topics.sh --list --zookeeper localhost:2181
kafka安全
kafka默认是明文传输,并且没有密码验证。如果是外网,则需要进行鉴权。
注意,filebeat只支持SASL/PLAIN验证。
配置SASL/PLAIN
在conf/server.properties文件中添加
listeners=SASL_PLAINTEXT://host:9092
security.inter.broker.protocol=SASL_PLAINTEXT
sasl.enabled.mechanisms=PLAIN
sasl.mechanism.inter.broker.protocol=PLAIN
在config目录下新建三个文件:
- kafka_server_jaas.conf
KafkaServer {
        org.apache.kafka.common.security.plain.PlainLoginModule required
        username="admin"
        password="12345678"
        user_admin="12345678"
        user_alice="123456";
};
- kafka_cilent_jaas.conf
KafkaClient {
        org.apache.kafka.common.security.plain.PlainLoginModule required
        username="alice"
        password="123456";
};
- kafka_zoo_jaas.conf
zookeeper {
        org.apache.kafka.common.security.plain.PlainLoginModule required
        username="admin"
        password="12345678";
};
- zookeeper-server-start.sh最后一行的前一行添加:
export KAFKA_OPTS=" -Djava.security.auth.login.config=/usr/local/src/kafka_2.11-1.0.1/config/kafka_zoo_jaas.conf"
- kafka-server-start.sh最后一行的前一行添加: export KAFKA_OPTS=” -Djava.security.auth.login.config=/usr/local/src/kafka_2.11-1.0.1/config/kafka_server_jaas.conf”
- kafka-console-consumer.sh和kafka-console-producer.sh中添加:
export KAFKA_OPTS=” -Djava.security.auth.login.config=/usr/local/src/kafka_2.11-1.0.1/config/kafka_client_jaas.conf”
- 重启kafka集群
filebeat配置kafka输出
vim /etc/filebeat/filebeat.yml
output.kafka:
  # initial brokers for reading cluster metadata
  hosts: ["localhost:9092"]

  # message topic selection + partitioning
  topic: 'filebeat'
  partition.round_robin:
    reachable_only: false
  username: 'alice'
  password: '123456'
  required_acks: 1
  compression: gzip
  max_message_bytes: 1000000
配置logstash输入
创建SASL/PLAIN账号密码配置文件 vim /etc/logstash/kafka_cilent_jaas.conf
KafkaClient {
        org.apache.kafka.common.security.plain.PlainLoginModule required
        username="alice"
        password="123456";
};
vim /etc/logstash/conf.d/logstash-simple.conf
input {
  kafka {
    bootstrap_servers => ["localhost:9092"]
    topics => ["filebeat"]
    group_id =>"logstash"
    jaas_path => "/etc/logstash/kafka_cilent_jaas.conf"
    sasl_mechanism => "PLAIN"
    security_protocol => "SASL_PLAINTEXT"
    codec => "json"
  }
}
重启filebeat和logstash
分析nginx日志效果预览:
仪表盘

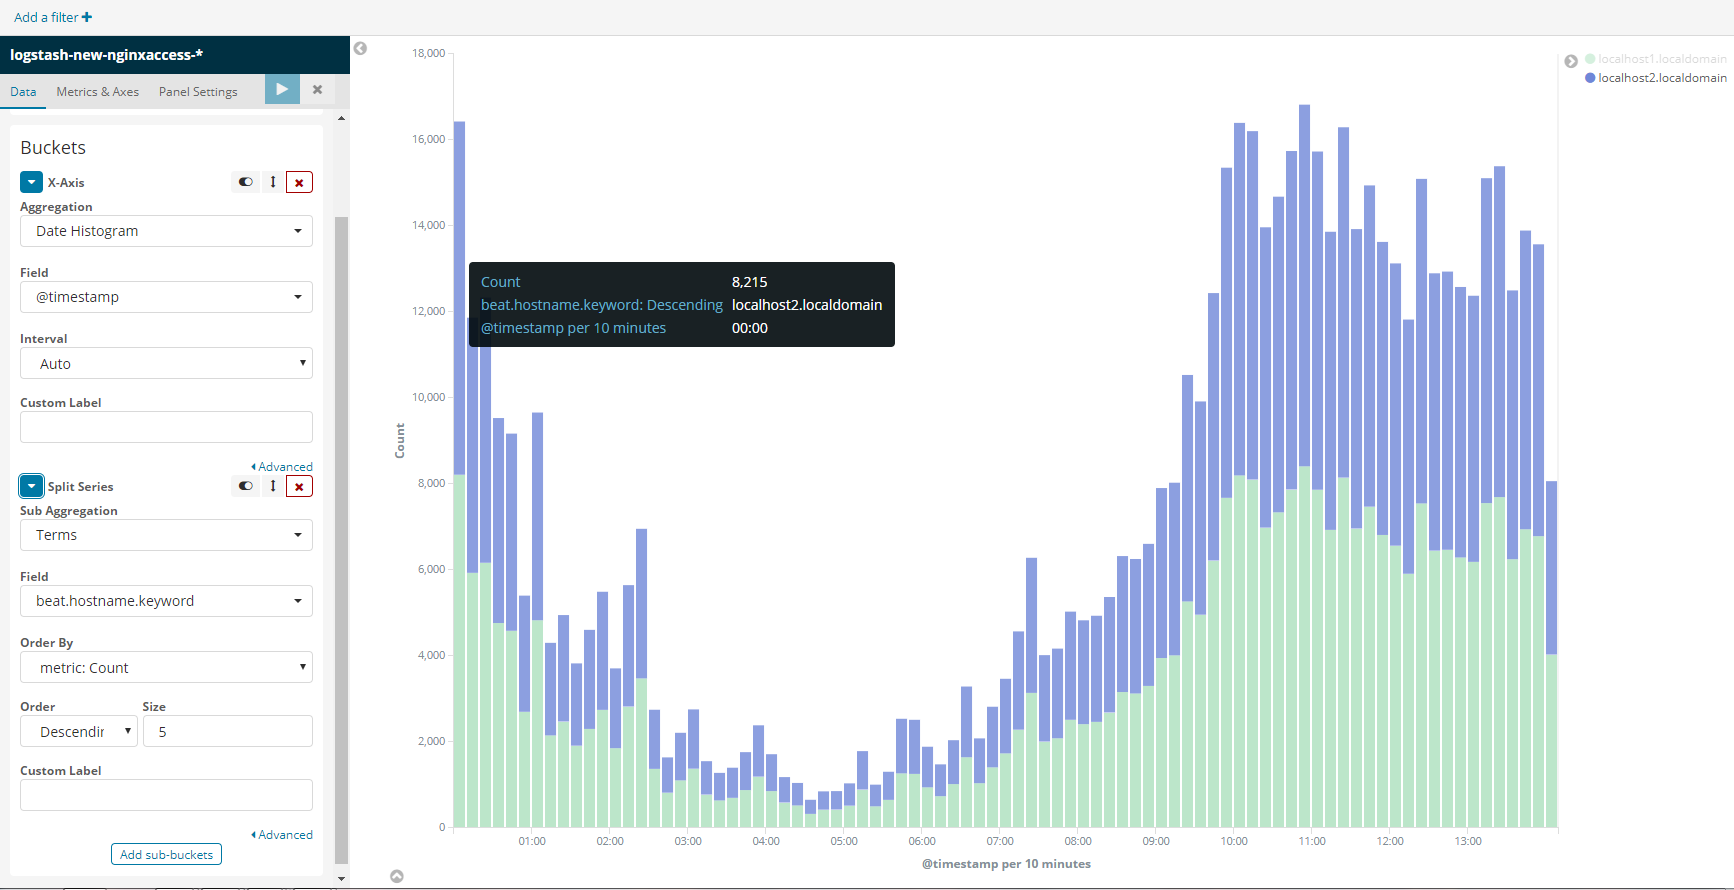
实时并发访问统计(柱中不同颜色区分不同服务器来源的日志,可以概览负载是否均衡)
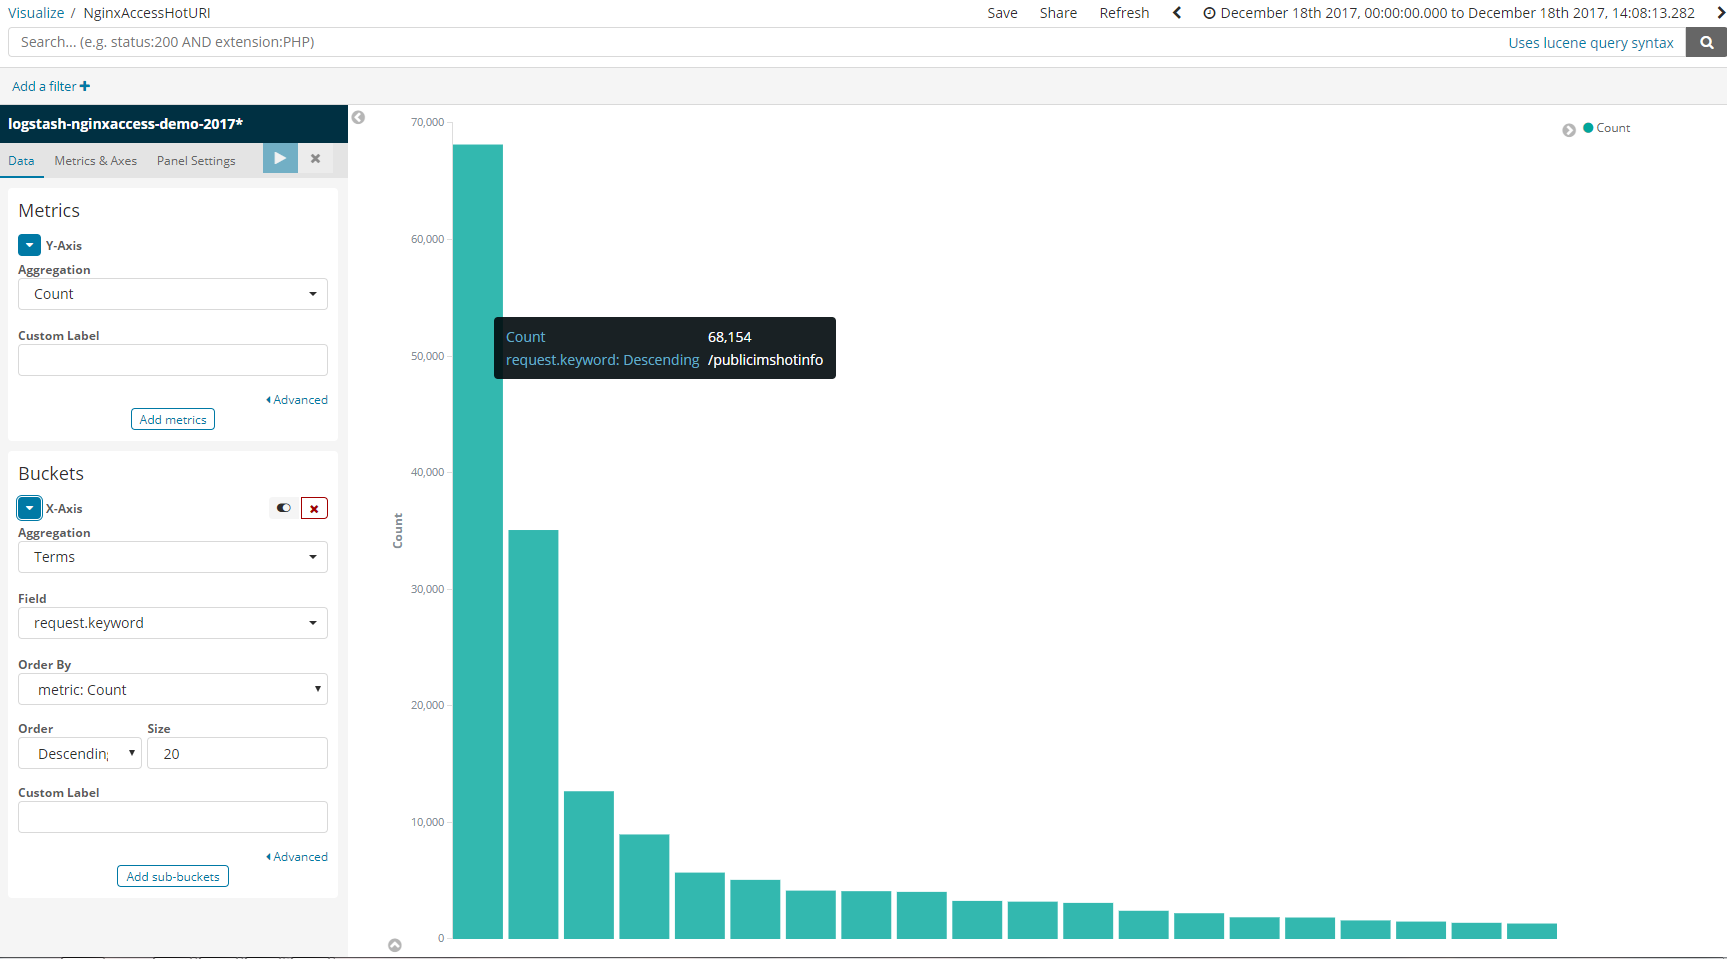
热点URI统计(top10)
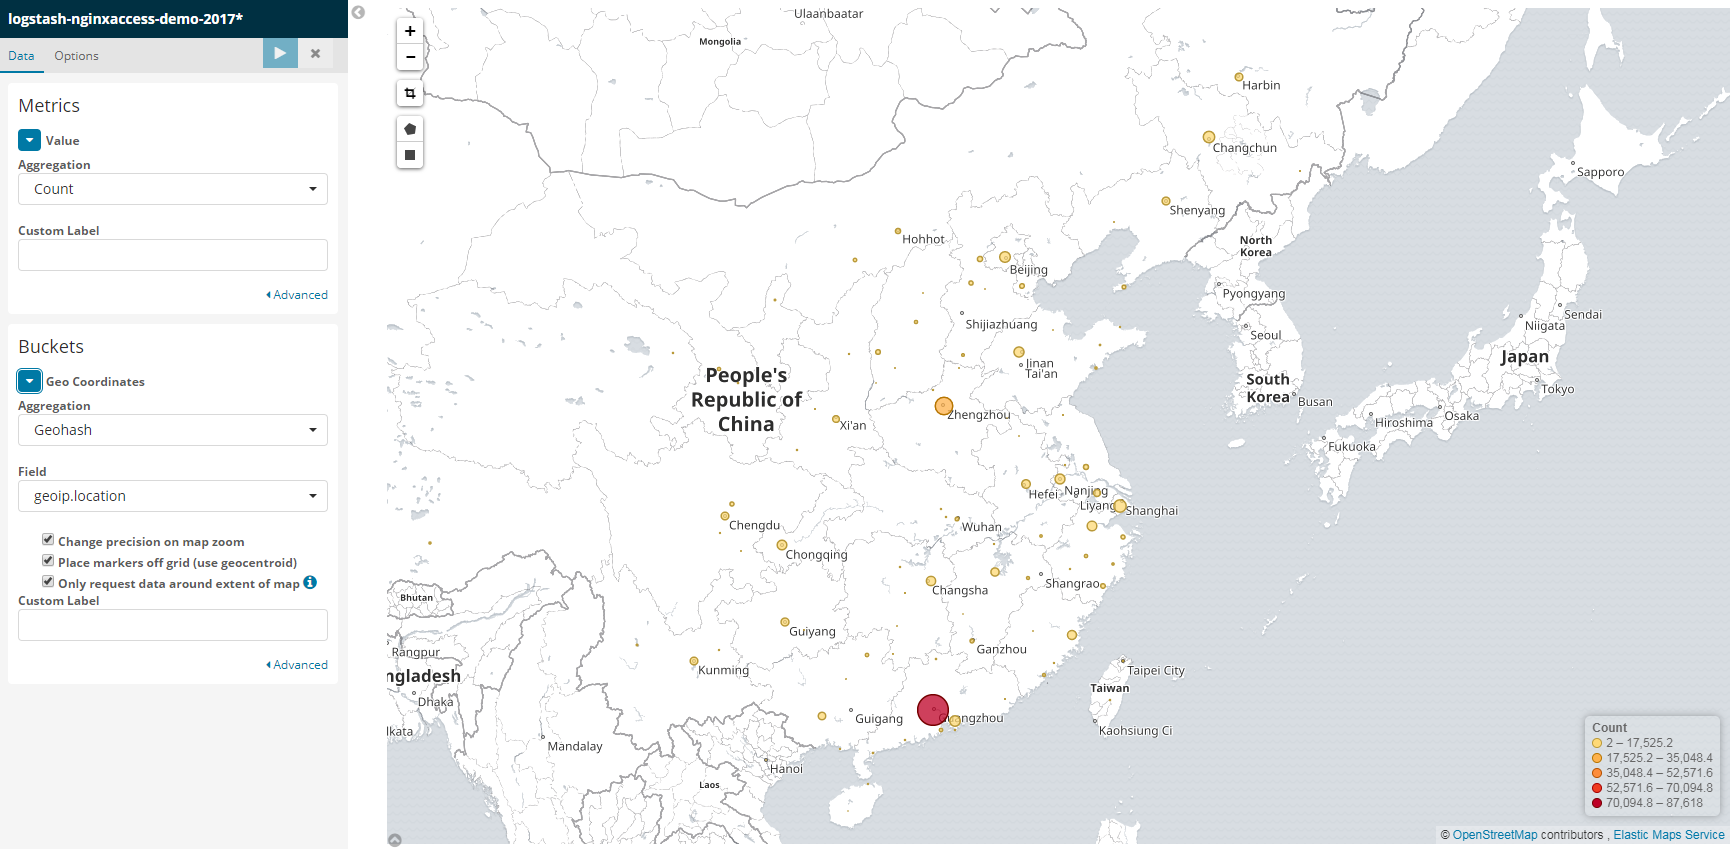
用户地域分布
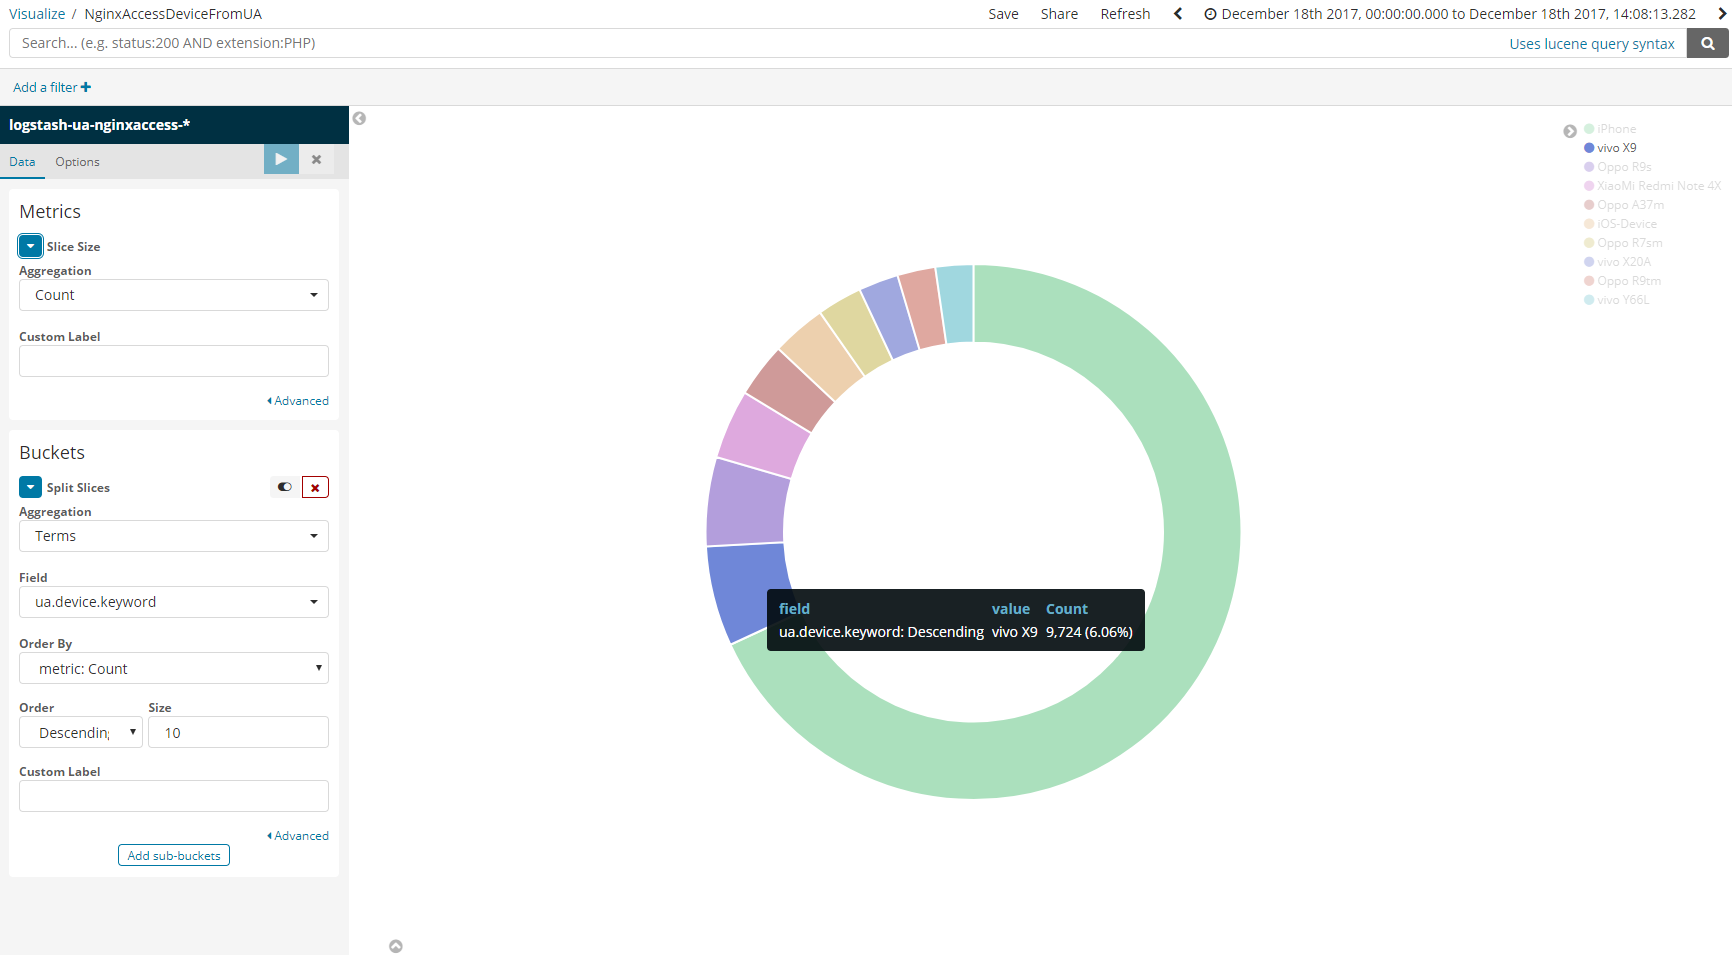
用户手机设备分布
(全文完)